I’ve been taking different AUV datasets through Qimera and I must say, it is really easy. It is even easier now that as well as the post processed inertial SBET format, I have been beta testing the Kongsberg Navlab post processed position and pressure formats too. It only took a minute to get all the data into the project and be ready for processing.
So I thought I would walk through the steps.
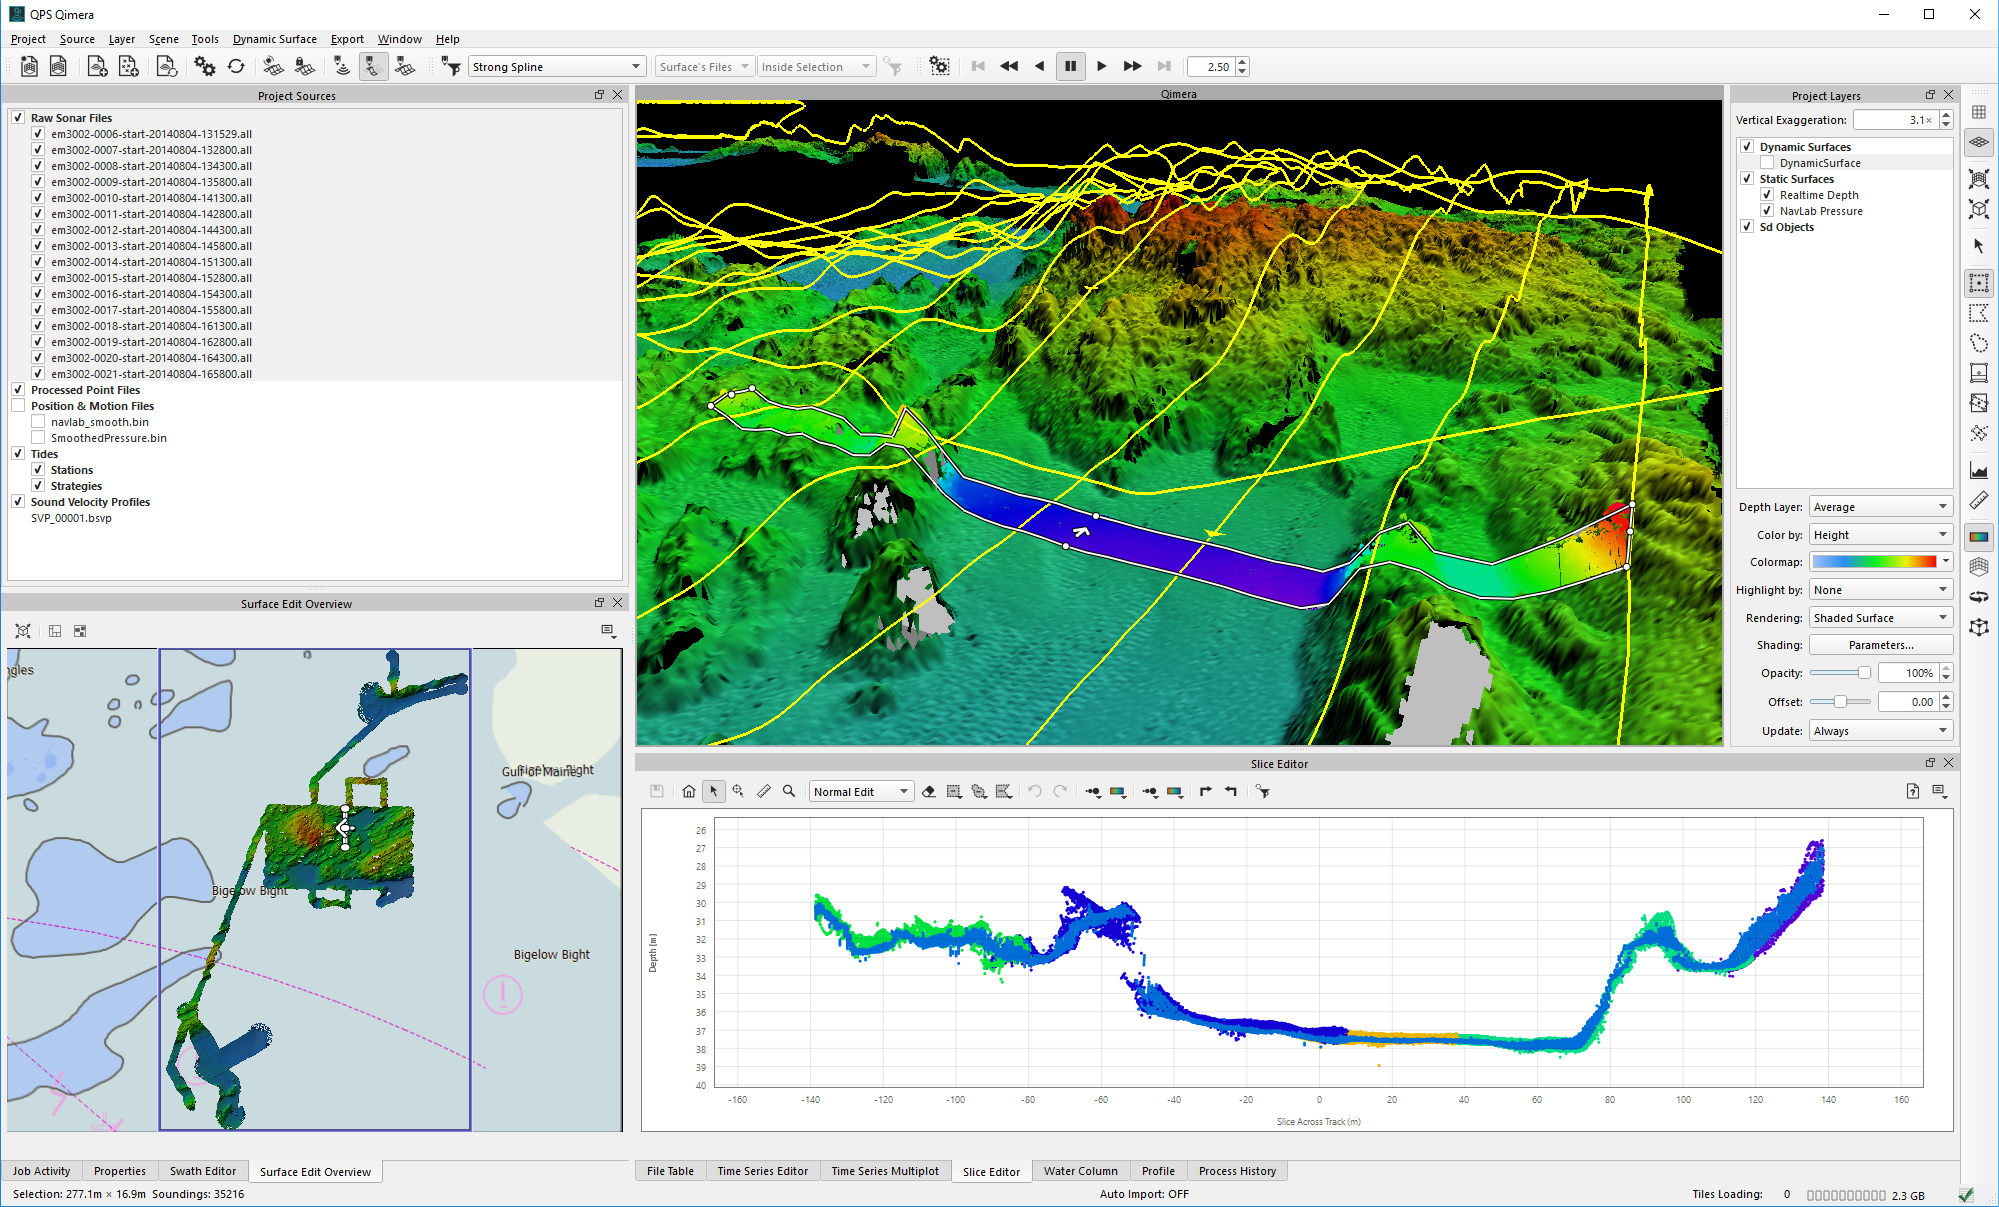
I used the data from the CCOM/UNH AUV Bootcamp from 2014 which was based on a Kongsberg Hydroid REMUS AUV equipped with an EM3002 and a HAIN inertial system. The output to be entered into Qimera are Kongsberg *.ALL files for the bathymetry (and backscatter) and then a navlab_smooth.bin for for post processed position and a SmoothedPressure.bin file for the post processed pressure.
Data is loaded into Qimera by just loading in the *.ALL files. Qimera also automatically realises it is an AUV from the file, which disables heave and introduces (Depth). It then automatically extracts the depth sensor data from the *.ALL file too.
The Navlab position file is then imported as Binary Navigation data. Rather than over-riding data it creates a new sensor, i.e. a new position system. Likewise the pressure is added in the same way as a new pressure system. Qimera prompts to tell you that new data has been inserted and you should process this – just with one button. The dynamic surface automatically updates so there is no reason to re-grid or re-compute anything.
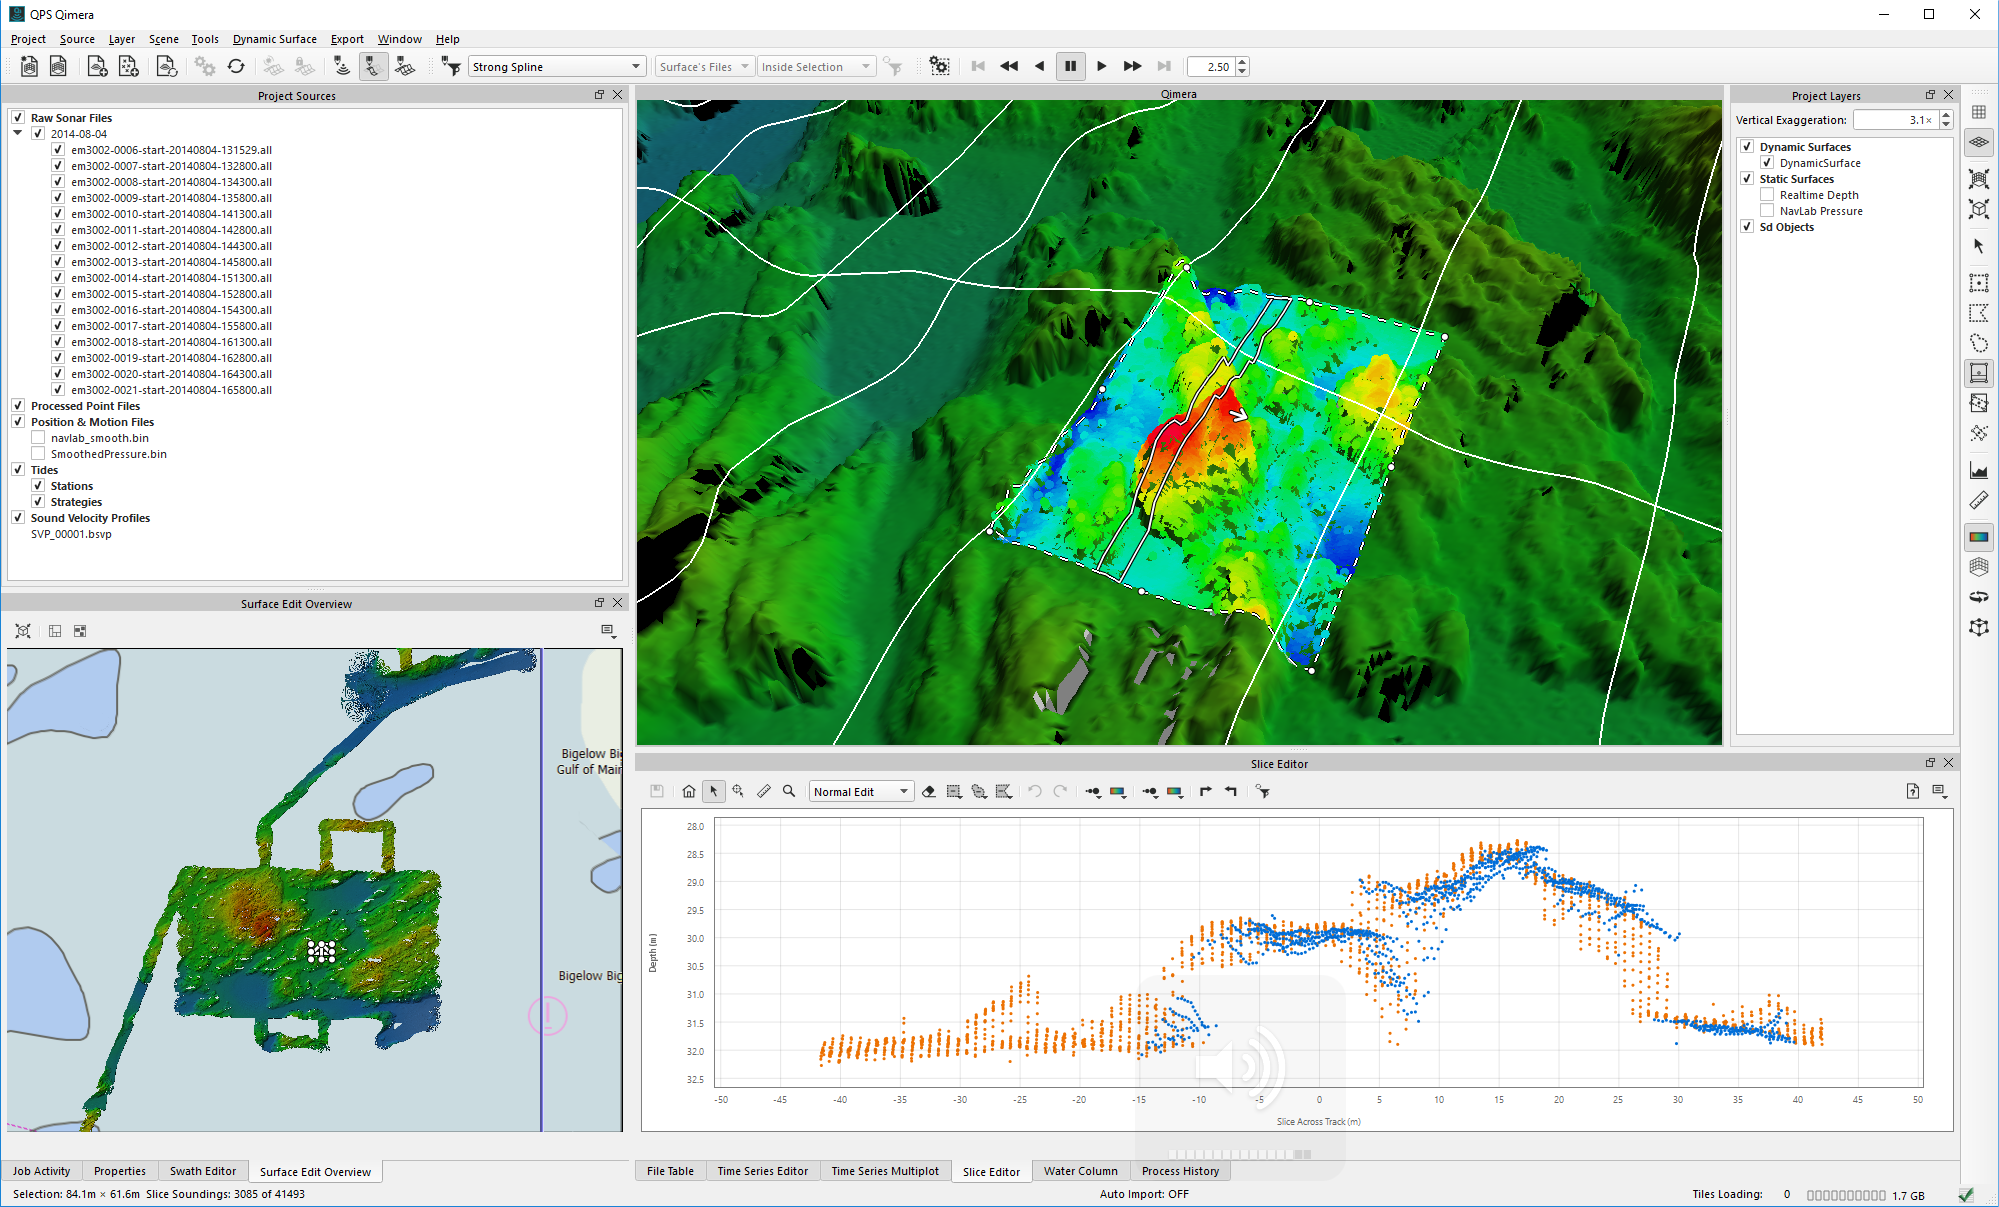
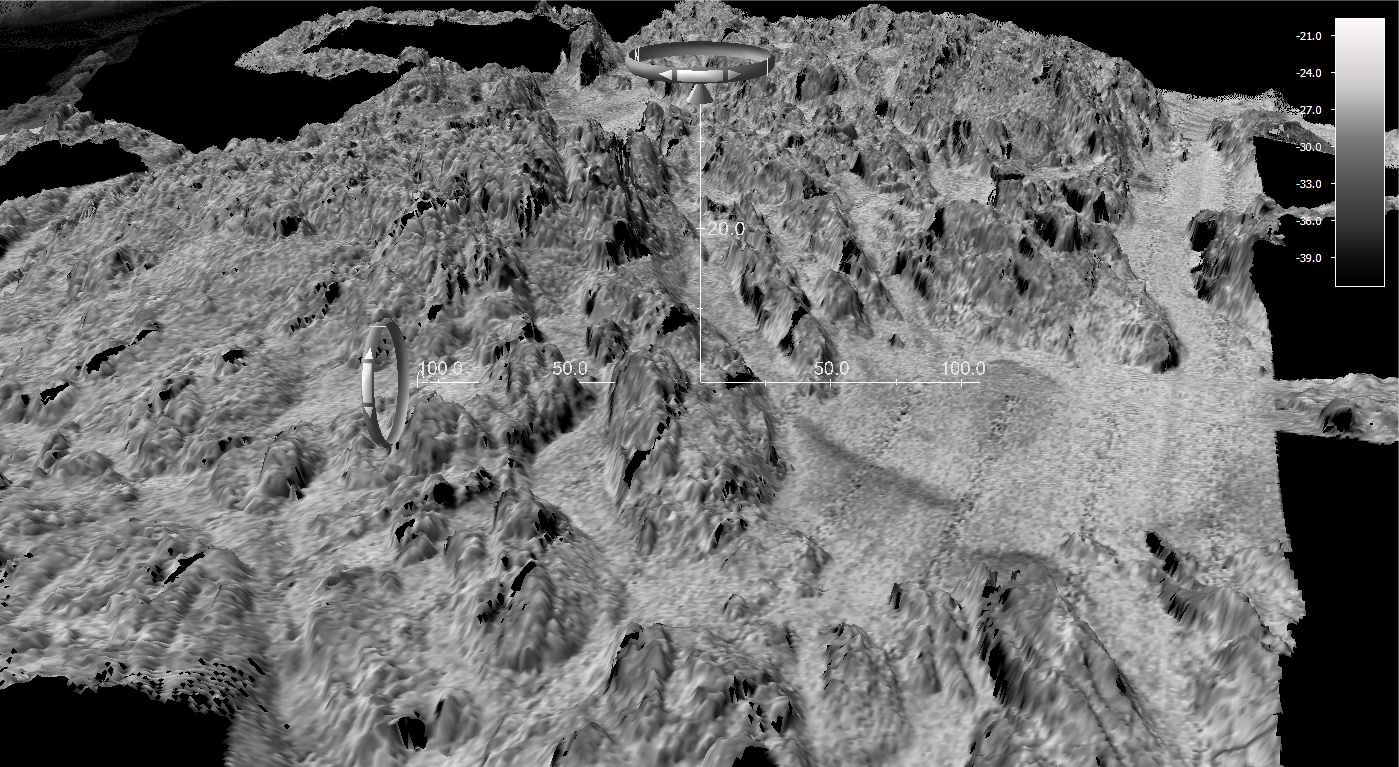
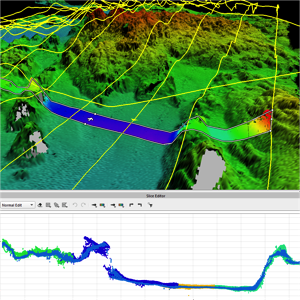
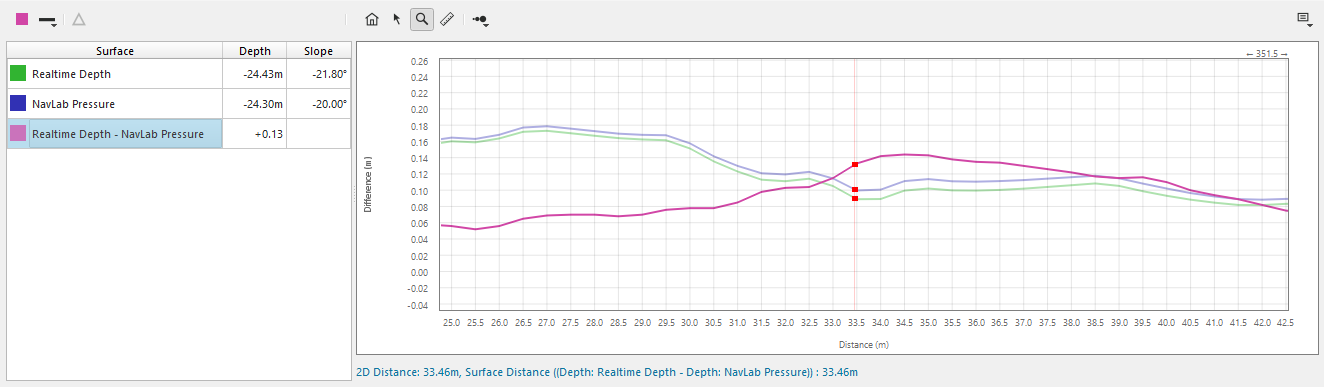
In the image above it shows that features line up quite nicely after using the post processed files. There is about an hour between the two lines of data, so enough time for the AUV’s inertial sensor to start drifting. Qimera also has a nice profile tool and in the example below I created pre and post surface models and am comparing the results to see the change in depth from real time to post processed.
AUV data is really clean as it doesn’t have any of the issues with bubble wash or interference or just being next to a noisy vessel so data cleaning is almost non-existent. It is good to clean the bathymetry prior to backscatter processing as spikes effect the backscatter mosaic. Once cleaned I created a bathy DTM which Fledermaus Geocoder Toolkit (FMGT) will use for slope correcting the backscatter. The processed data is loaded into FMGT and mosaic is a one button push. The bathy DTM and the mosaic were then brought into Fledermaus where the backscatter was draped onto the DTM. The neat trick here is that using the Fledermaus sun-illumination technology the features of the seabed and therefore the roughness of the seabed is shown through the backscatter.
So the final result is a lovely draped DTM from which to digitise seabed sediment disribution or to add video footage or photos or to share via Google Earth, 3D PDFs or straight into ESRI ArcGIS.