An excellent article here Read more… on the @KOGMaritime Kongsberg MUNIN’s pipeline inspection project in the Great Lakes. I used it to test out AUV processing in Qimera (following on from Loch Ness) and also the new pipeline inspection capability in Fledermaus. The image is showing the results in Fledermaus with the point cloud from […]
Jan
14
2016
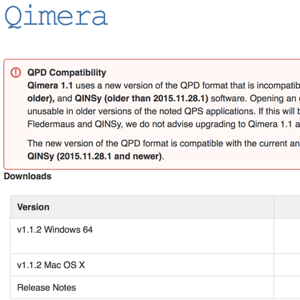
Qimera now available on OS X
Qimera (@QPSQimera) is now out to download from the QPS website. Looks great and runs faster than Windows (in my opinion anyway!). Download away https://confluence.qps.nl/display/dwn/Qimera
Aug
27
2015
Qimera on OS X
Qimera is almost out on the Mac! I’m just testing out a pre-release build of Qimera 1.1. It was first released just on Windows but with 1.1 it will be on OS X and Linux. So for those of you with MBSystem, give QPS Qimera a go.
Aug
27
2015
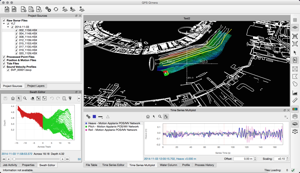
Surveying with ROVs? You need Time Series Multiplot
One of the main sources of error when conducting multibeam surveys from ROVs is the timing of the data producing artfacts in the bathymetry. Finding out what the latency is has not been easy. The way it used to be calcuated was to extract the roll data and an outer beam value and compare the […]
Jul
30
2015
Using an R2Sonic sonar and wanting to process backscatter?
If you are wanting to collect great backscatter data to create mosaics then this poster from Jonathan Beaudoin is a must read. It shows you how to set the sonar up, use SVP data and then process it in FMGT. Download the poster and stick it on your wall here http://www.qps.nl/download/attachments/14352930/beaudoin_r2sonic_poster.pdf?version=1&modificationDate=1400116368523
Jul
29
2015
ESRI’s Chart Server – super cool!
Here is the link to the NOAA ENC server powered by ESRI’s Chart Server. You can see the ENCs normally or you can use them with the ESRI Basemaps like the Image one in the second picture. The ENC can be fully inspected too. A bit more info; The NOAA ENC Online viewer is […]
Jul
24
2015
Check out the sat dome on E/V Nautilus! Very privi…
Check out the sat dome on E/V Nautilus! Very privileged to have a tour today. instagram.com/p/5gLDbOoBZ3/
Jul
13
2015
Watch “Perspectives on Ocean Exploration” by @AOPA…
Watch “Perspectives on Ocean Exploration” by @AOPAVCreative on @Vimeo vimeo.com/129613083
Gallery


